Drivers often wonder why pump prices seem slow to fall when crude oil drops, or why a Gulf Coast storm can spike gas costs weeks later. The answer lies in a supply chain that takes roughly six weeks to move a barrel of crude from a wellhead into your fuel tank. Understanding the stages, and the delays built into each one, helps explain the price behavior most consumers find frustrating.
Week 1: Extraction and Initial Transport
The journey begins at the wellhead, where crude is pumped from formations in places like the Permian Basin, the Bakken, or offshore Gulf of Mexico platforms. Producers sell that crude on contracts tied to benchmark prices such as WTI or Brent, but the physical barrel does not move at the speed of the futures market. It first goes into gathering lines, then into larger pipelines or onto rail cars and tankers.
This initial leg typically takes several days to a week, depending on distance to a refinery. Storage terminals along the way act as buffers, which means the crude entering a refinery this week was likely priced and committed to weeks earlier. That timing gap is the first reason pump prices do not track daily oil headlines in real time.
Weeks 2 to 3: Refining Into Gasoline
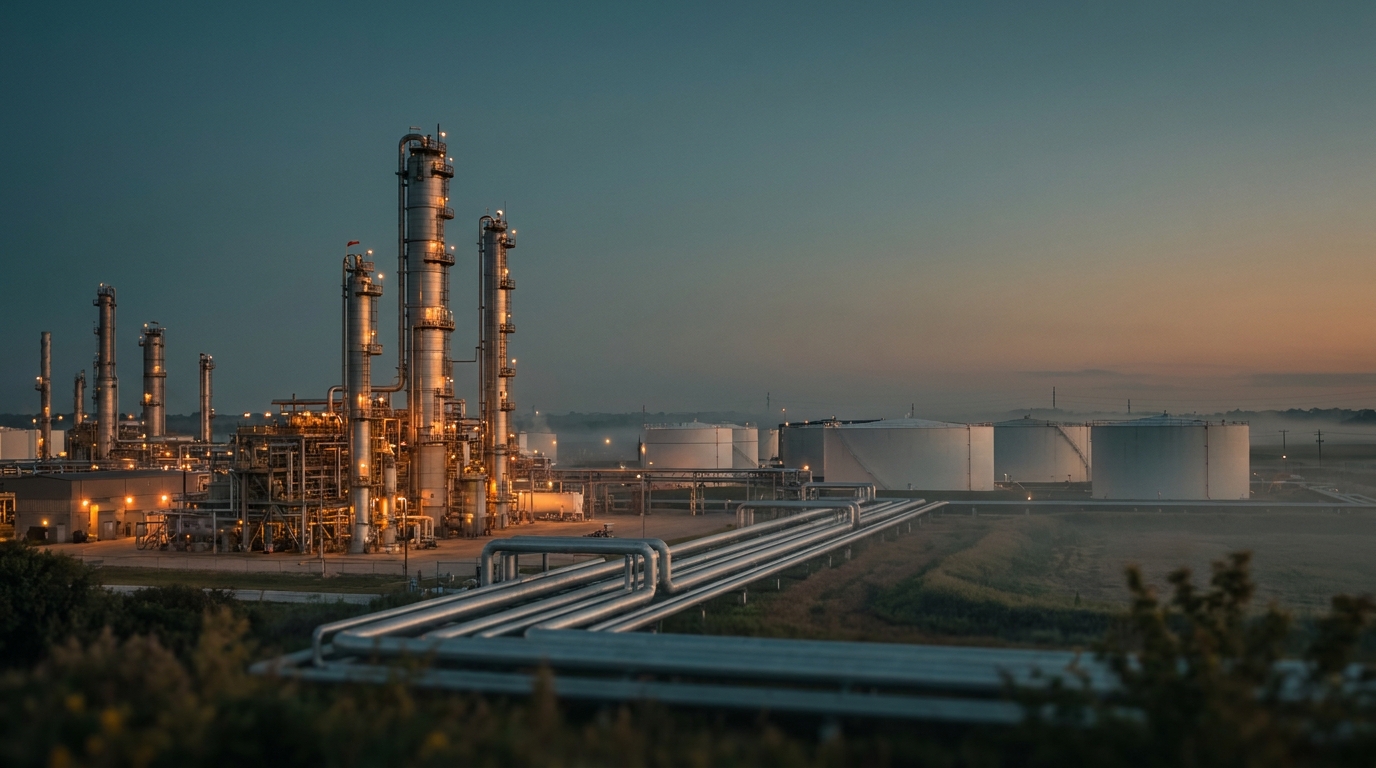
Once crude arrives at a refinery, it undergoes distillation, cracking, and blending. A modern US refinery turns roughly 45 percent of each barrel into motor gasoline, with the rest split among diesel, jet fuel, and other products, according to the US Energy Information Administration. The refining process itself runs continuously, but a specific barrel typically spends one to two weeks moving through the system before it leaves as finished gasoline.
Refiners also adjust output for seasonal blend requirements set by the Environmental Protection Agency. Summer-grade gasoline, required in much of the country from June through September, costs more to produce than winter blends. That switch happens in the spring and creates predictable upward pressure on wholesale prices.
Weeks 4 to 5: Wholesale Distribution
Finished gasoline leaves the refinery through pipelines such as Colonial or Plantation, or by barge and truck, heading to regional terminals known as racks. At the rack, wholesalers, jobbers, and branded suppliers load tanker trucks for delivery to individual stations. Wholesale prices at this stage are reported daily and are what station owners actually pay.
Regional bottlenecks matter here. The West Coast and Northeast rely on fewer pipelines and stricter fuel specifications, which is why California and New England prices often diverge from the national average. A single refinery outage or pipeline disruption can ripple through this stage for weeks before consumers notice at the pump.
Week 6: Station Pricing and the Retail Lag
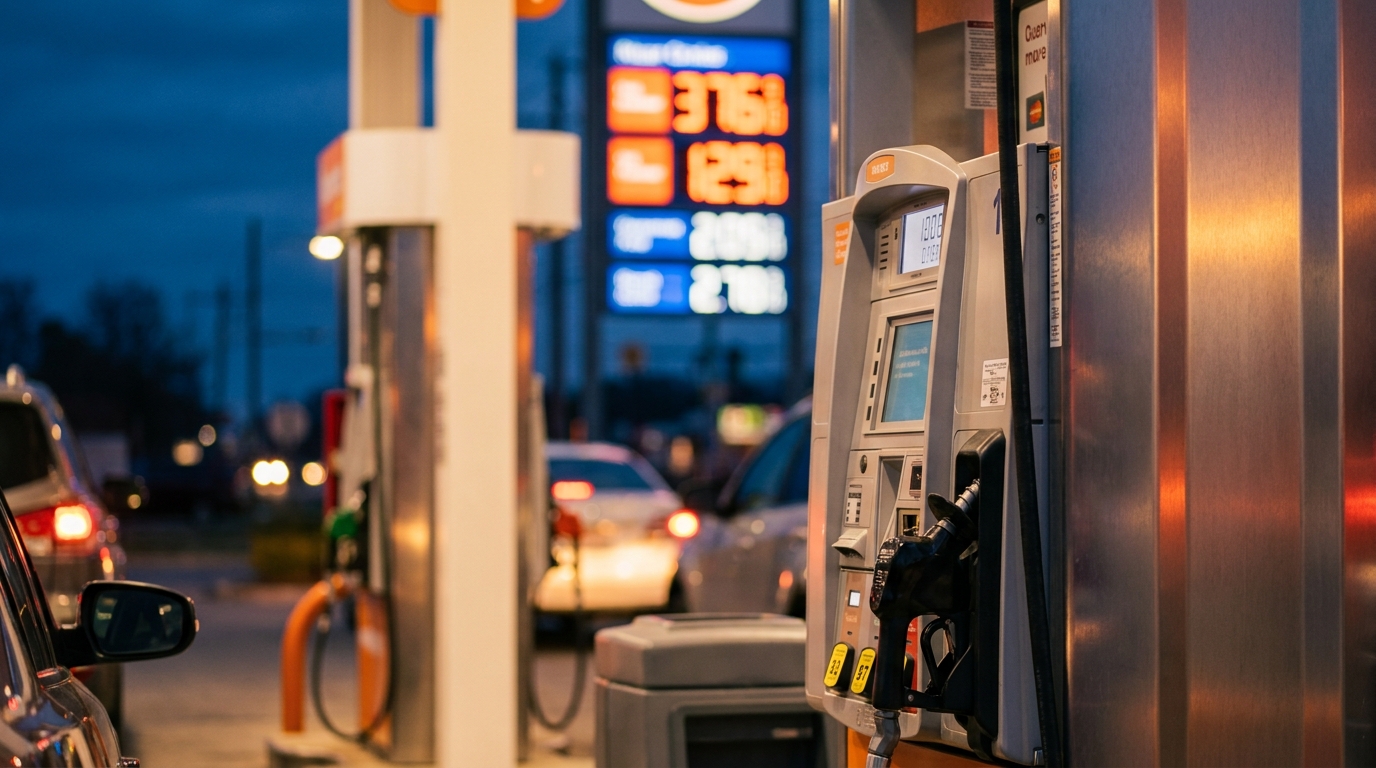
By the time gasoline reaches a station, its cost has been locked in through the earlier stages. Station operators, who typically earn only a few cents per gallon in margin, adjust retail prices based on their most recent wholesale delivery and local competition. When wholesale costs rise, retail prices tend to move within days. When they fall, retail prices often drift down more slowly, a pattern economists call rockets and feathers.
Federal and state taxes are added at the pump. The federal excise tax is 18.4 cents per gallon, and state taxes range widely, from under 20 cents in a few states to over 60 cents in California, according to the US Department of Energy. These taxes are fixed in the short term and do not track crude oil movements at all.
What This Means for Price Watchers
The six-week timeline explains why a crude oil rally in October can still be showing up at gas stations in late November, and why a drop in oil prices rarely produces immediate relief. It also clarifies why weather events, refinery fires, and pipeline issues have delayed but powerful effects on what drivers pay.
Watching wholesale rack prices and EIA weekly petroleum reports gives a better forecast of pump prices than tracking crude futures alone. Both data sets are publicly available and updated on predictable schedules.
The takeaway
If you want to anticipate pump prices, do not watch daily crude oil headlines. Watch EIA weekly petroleum reports and regional wholesale rack prices, which lead retail by days rather than weeks. Remember that taxes and refining costs, not just crude, drive nearly half of what you pay. And expect price drops to arrive slower than price increases. That asymmetry is a feature of the supply chain, not a conspiracy.