Every new car sold in the UK carries an official fuel economy figure derived from the Worldwide Harmonised Light Vehicle Test Procedure (WLTP). Introduced in 2017 to replace the widely discredited NEDC test, WLTP was meant to close the gap between showroom claims and what drivers actually see on the trip computer. Six years in, the gap has narrowed — but it has not closed. Using data patterns reported by the AA, RAC Fuel Watch commentary and independent trackers such as Spritmonitor and Honest John's Real MPG, we look at how Britain's twenty best-selling cars actually perform.
What WLTP measures — and what it misses
WLTP runs a car through four phases (low, medium, high and extra-high speed) over roughly 30 minutes on a rolling road, at controlled temperatures and with a defined driving cycle. It is more representative than the old NEDC lab test, which flattered small petrols and diesels by around 20–25% according to Transport & Environment's long-running analysis.
But WLTP is still a laboratory test. It does not account for cold British winters, short urban trips where the engine never reaches operating temperature, roof boxes, underinflated tyres, ethanol content in E10 petrol, or the simple fact that most motorway drivers sit at 70–75 mph rather than the test's gentler high-speed phase. The DVSA publishes the figures manufacturers submit; it does not retest them in service.
The gap across the UK top 20
Cross-referencing SMMT registration data for 2023–24 best-sellers with owner-reported figures on Spritmonitor and Honest John Real MPG shows a consistent pattern. Conventional petrol hatchbacks (Ford Puma, Vauxhall Corsa, Nissan Juke, MINI) typically miss their combined WLTP figure by 10–15%. Diesel SUVs and estates (Kia Sportage diesel, Nissan Qashqai diesel where still available) fare better, usually within 8–12%.
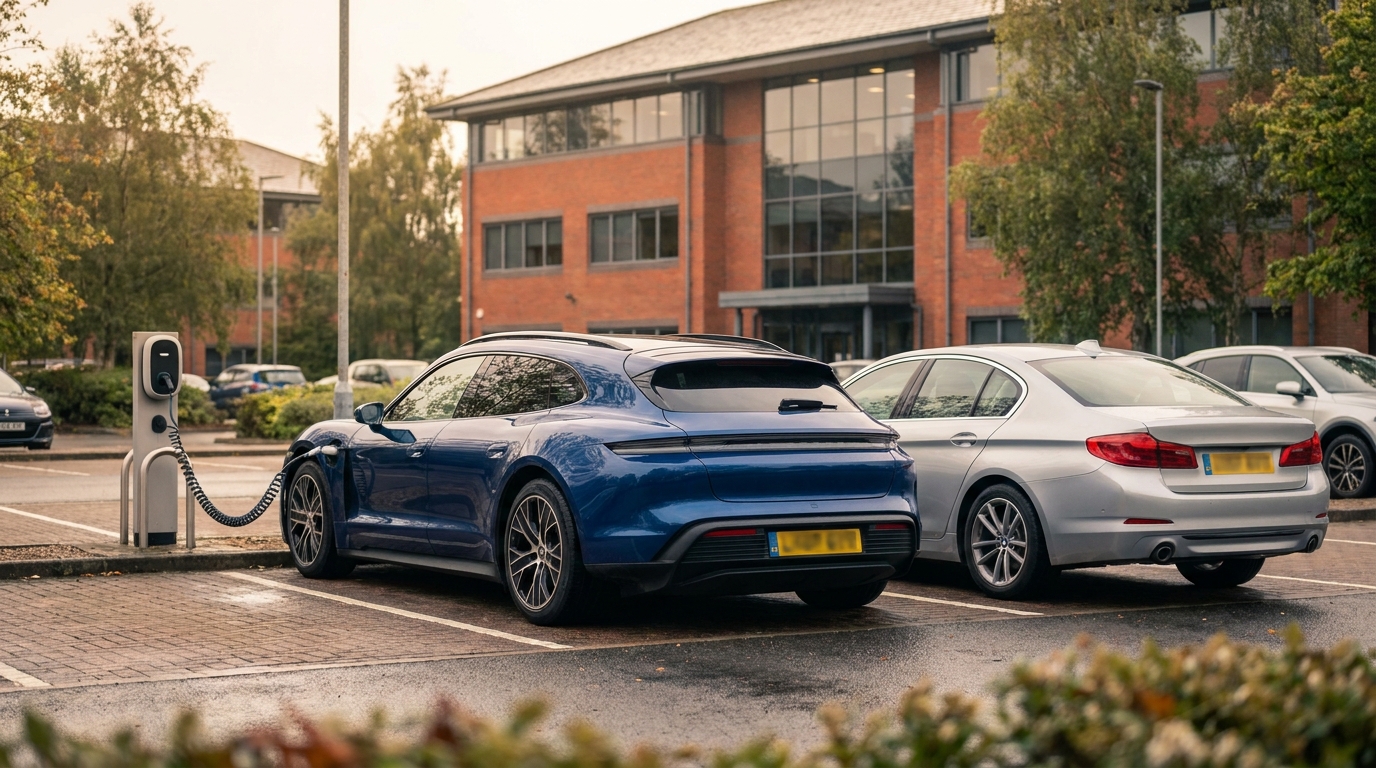
The outliers sit at both ends of the electrification spectrum. Full hybrids such as the Toyota Yaris Cross and Corolla come closest to their claims — often within 5–8%, and occasionally beating them in stop-start urban use. Plug-in hybrids show the largest divergence: a Kuga PHEV or Sportage PHEV claiming 200+ MPG on WLTP will realistically return 40–60 MPG once the battery depletes and the driver stops plugging in, as the European Commission's JRC confirmed in its 2022 real-world PHEV study.
Battery-electric models are outside the MPG conversation but face the same test-versus-reality tension, with real-world range typically 15–25% below WLTP in winter.
Why your MPG might be worse than the averages
The published gaps are medians. Individual results vary widely, and a handful of controllable factors dominate. Short journeys are the single biggest destroyer of economy: DESNZ's road fuel consumption data implies that trips under three miles can halve effective MPG in petrol cars, because the catalytic converter and engine oil never warm up.
Speed matters more than most drivers realise. The Department for Transport's own guidance notes fuel consumption typically rises around 15% between 60 and 70 mph, and another 10% between 70 and 80 mph. Tyre pressure 6 psi below spec — common on cars that never see a forecourt gauge — costs roughly 2–3% in economy.
What to do with the numbers
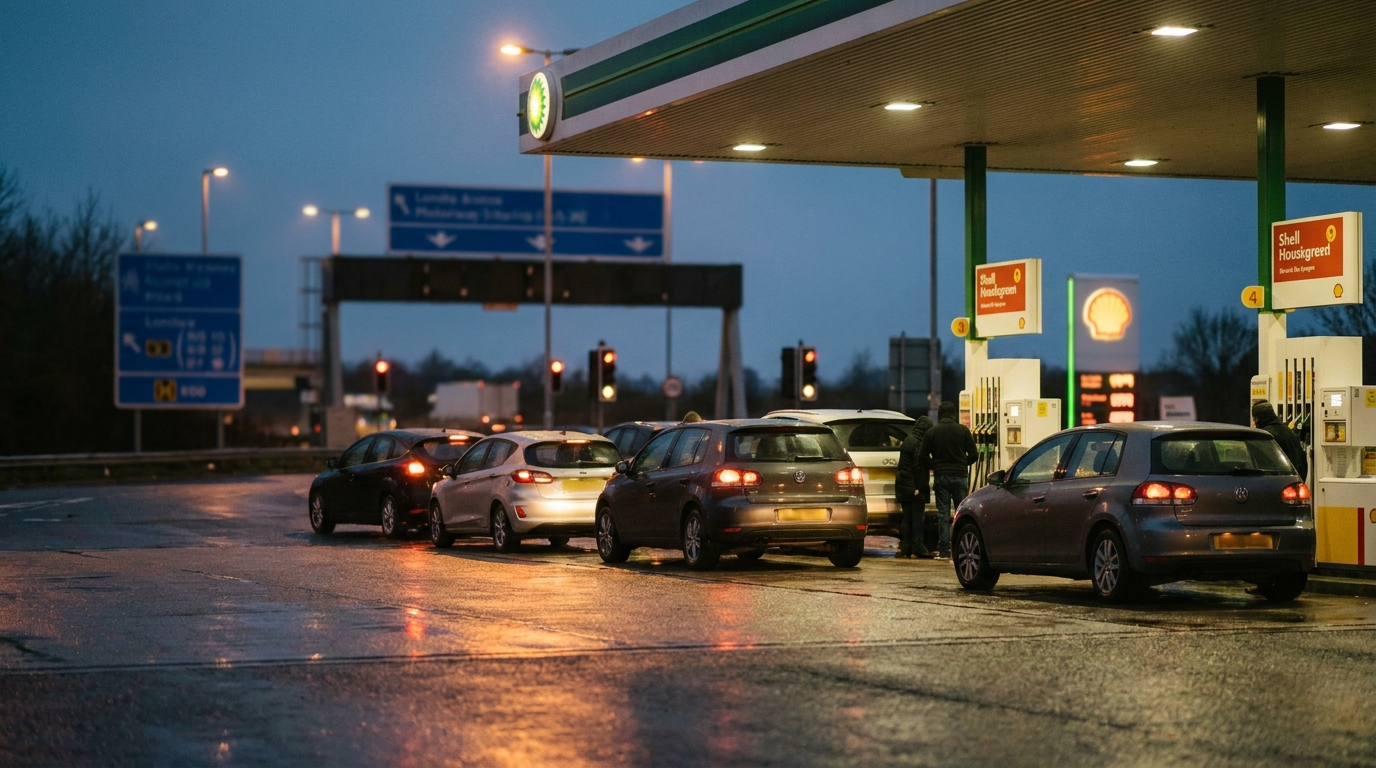
For buyers, the practical rule is simple: mentally discount the WLTP combined figure by around 12% for petrol, 10% for diesel, 7% for full hybrid, and treat any PHEV claim above 100 MPG as fiction unless you can commit to charging daily. That gives a working budget for weekly fuel spend at prevailing DESNZ pump averages (currently around 135p/L petrol and 143p/L diesel).
For existing owners, the gap is partly under your control. A well-maintained car driven at 65 mph rather than 75 mph, with correct tyre pressures and without a roof box, can close half the shortfall to WLTP on its own.
The takeaway
WLTP is a better yardstick than NEDC, but it remains a laboratory measurement conducted under conditions no UK driver ever experiences. Expect a 10–15% shortfall for most petrols and diesels, a smaller one for full hybrids, and a very large one for plug-in hybrids used without discipline. Treat the sticker figure as a ceiling, not a promise — and when comparing two shortlisted cars, compare their real-world numbers from owner databases alongside the official ones.